
decomposition of light

rainbow over the Federal
Hill, Baltimore
Everybody knows spectra from the light dispersing effect from a rainbow. It is based on the effect that a medium as a prism or grating can decompose light into its constituent colours – a discovery attributed to Isaac Newton (1642–1727). The prismatic effect as we know it for instance from the water drops in the rainbow is due to the refraction of light. Diffraction gratings consist of a surface with a series of equally-spaced, very fine parallel lines which disperse light by interference – a phenomenon which can be observed for instance on a surface of a DVD or CD-ROM.
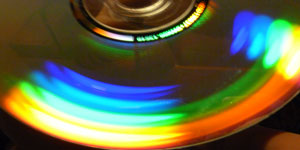
a DVD surface can be used for simple spectral analysis:
Here the emission spectrum of
a fluorescent lamp
with
its
non-continous colour bands becomes visible.
The spectrum appeared to Newton to be a continuous band of colour. Today anyone can observe that some spectra are not continuous by using the surface of a DVD or CD-ROM to reflect a light source into the eye. With such a simple ‘diffraction grating’ it can be observed for instance that the light of the setting Sun reveals strong black bands due to its long passage trough the air, or that the light of a fluorescent lamp is emitted in discrete bands.
It was the optician Joseph Fraunhofer (1787–1826) who, in 1814, systematically explored the solar spectrum to discover over 500 of these dark lines. At the same time, chemists started to discover non-continuous spectra of bright lines in the dispersed light emitted from various chemical elements and compounds during combustion or vigorous heating. They discovered that each element emits a characteristic set of lines which vary in their relative brightness according to the method of excitation. It was the German chemist Gustav Kirchhoff (1824–1887) who discovered in 1959 that elements might emit light at specific wavelengths emission spectrum, but they are also able to absorb light at the very same wave length to produce an absorption spectrum. Consequently the dark absorption lines in a stellar spectrum as from our sun could be identified with the existence of specific chemical elements in the Sun's atmosphere.
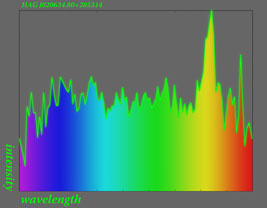
For the analysis of spectra it is relevant to know
about the intensity of each spectral line. This is
why spectra often are noted as intensity diagrams.
The drawn curve indicates the luminosity (x axis)
at a specific wave length (y axis).
In science prisms or gratings are joined in an instrument called a ‘spectroscope’ to analyse the composition of light. The spectroscope, first used with the eye as the detector and later combined with photography to collect more of the faint light — the so-called ‘spectrograph’ — ranks as one of the most important scientific intruments ever invented and it has brought us knowledge and understanding of the world from the scale of atoms to the size of the Universe. Finally in astrophysics spectra are not only a fingerprint of elements giving us information about the composition of a celestial object, it also tells us also about its temperature, velocity and distance.(more...)
translating spectra into a laser projection
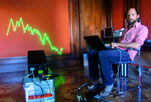
Benjamin Staude setting up a
laser test in the Franchetti
Palace in Venice 2010
It is quite at hand to use the graphical medium of a laser to translate spectra into a projection. Reminiscent of an oscilloscope, the laser was used to translate the spectral coordinates into the wave pattern. This was achieved by a python-based interface developed by Benjamin Staude, that computes the laser coordinates from the spectra and directly sends them to the laser projector, thereby avoiding the use of intricate commercial laser software (more...).
![]()
![]() Decoding the light of Hubble - further explannations how Hubble spectra are decoded on Hubblesite.org
Decoding the light of Hubble - further explannations how Hubble spectra are decoded on Hubblesite.org
Literature
Hentschel, Klaus: Mapping the spectrum - techniques of visual representation in research and teaching, Oxford: Oxford University Press 2002
Christensen, Lars Lindberg, Fosbury, Robert F., Hurt, Robert L.: Hidden Universe, Weinheim: Wiley-VCH 2008
Links
The CD ROM Spectroscope, a page by astronomer Joachim Köppen explaining how to use ordinary CDs or DVDs as spectroscopes
![]()
![]()
![]()